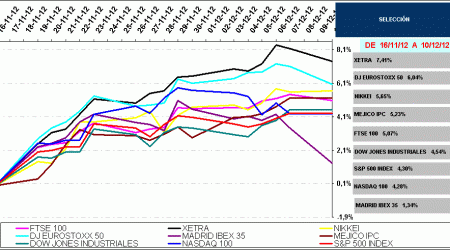
Graficos en base 100... 10 Dic 2012admin Emplearé gráficos en base 100 para seguir la evolución de una selección de los principales … Leer
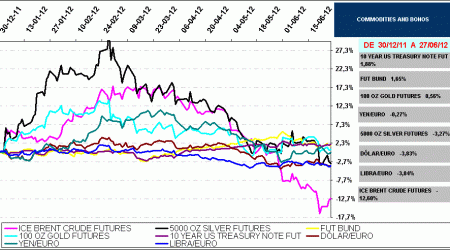
Graficos en base 100... 28 Jun 2012admin Emplearé gráficos en base 100 para seguir la evolución de una selección de commodities, … Leer
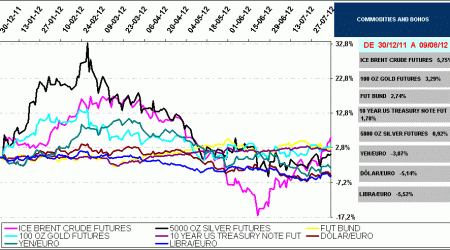
Graficos en base 100... 10 Ago 2012admin Emplearé gráficos en base 100 para seguir la evolución de una selección de commodities, bonos y divisas, en lo que va de año 2012. Superado el ecuador del … Leer
Europe Index, Eurostoxx sectors... 6 Ago 2011admin The tables below show the list of the best and worst performing stock index, … Leer
Asia, Europe and America... 5 Ago 2011admin The tables below show the list of the best and worst performing stock index and … Leer
Asia, Europe and America... 4 Ago 2011admin The tables below show the list of the best and worst performing stock index and … Leer
Asia, Europe and America... 3 Ago 2011admin The tables below show the list of the best and worst performing stock index and … Leer
Asia, Europe and America... 2 Ago 2011admin The tables below show the list of the best and worst performing stock index and … Leer
Asia, Europe and America... 30 Jul 2011admin The tables below show the list of the best and worst performing stock index and … Leer
Europe Index, Eurostoxx sectors... 22 Jul 2011admin The tables below show the list of the best and worst performing stock index, … Leer