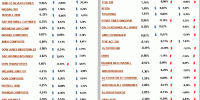
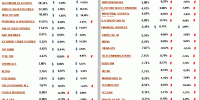
Europe Index, Eurostoxx sectors... 1 mayo, 2012admin The tables below show the list of the best and worst performing stock index, … Leer
Europe Index, Eurostoxx sectors... 31 diciembre, 2011admin The tables below show the list of the best and worst performing European stock … Leer
Europe Index, Eurostoxx sectors... 1 diciembre, 2011admin The tables below show the list of the best and worst performing stock index, … Leer
Europe Index, Eurostoxx sectors... 10 septiembre, 2011admin The tables below show the list of the best and worst performing stock index, … Leer
Europe Index, Eurostoxx sectors... 13 agosto, 2011admin The tables below show the list of the best and worst performing stock index, … Leer
Europe Index, Eurostoxx sectors... 8 agosto, 2011admin The tables below show the list of the best and worst performing stock index, … Leer
Europe Index, Eurostoxx sectors... 6 agosto, 2011admin The tables below show the list of the best and worst performing stock index, … Leer
Europe Index, Eurostoxx sectors... 2 agosto, 2011admin The tables below show the list of the best and worst performing stock index, … Leer
Asia, Europe and America... 2 agosto, 2011admin The tables below show the list of the best and worst performing stock index and … Leer
Europe Index, Eurostoxx sectors... 1 agosto, 2011admin The tables below show the list of the best and worst performing stock index, … Leer
Europe Index, Eurostoxx sectors... 31 julio, 2011admin The tables below show the list of the best and worst performing stock index, … Leer
Europe Index, Eurostoxx sectors... 24 julio, 2011admin The tables below show the list of the best and worst performing stock index, … Leer
Europe Index, Eurostoxx sectors... 22 julio, 2011admin The tables below show the list of the best and worst performing stock index, … Leer
Europe Index, Eurostoxx sectors... 21 julio, 2011admin The tables below show the list of the best and worst performing stock index, … Leer
Europe Index, Eurostoxx sectors... 21 julio, 2011admin The tables below show the list of the best and worst performing stock index, … Leer
Europe, Asian and America... 17 julio, 2011admin The tables below show the list of the best and worst commodities and stock index … Leer
Europe Index, Eurostoxx Sectors... 17 julio, 2011admin The tables below show the list of the best and worst stock index, eurozone … Leer
Ibex 35, Cac 40,... 24 noviembre, 2009admin Gráficos de comportamiento comparado actualizados con datos al cierre de la … Leer
Alcistas y bajistas en... 22 noviembre, 2009admin Empleamos matemática aplicada a la evolución bursátil de las compañías de … Leer
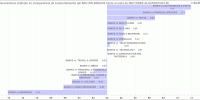
Histogramas con evolución de... 24 noviembre, 2009admin Con datos al cierre de la sesión del martes 24 de noviembre, tienen en formato … Leer
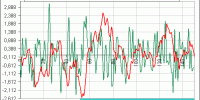
Desviaciones estándar en los... 6 septiembre, 2009admin Continuamos agregando activos a la herramienta que analiza las desviaciones … Leer
Expectativas en los integrantes... 28 octubre, 2009admin Aprovechando la herramienta que calcula a diario las desviaciones estándar en la … Leer
Desviaciones estándar en los... 22 noviembre, 2009admin Continuamos agregando activos a la herramienta que analiza las desviaciones … Leer