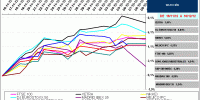
Europe Index, Eurostoxx sectors... 2 agosto, 2011admin The tables below show the list of the best and worst performing stock index, … Leer
Asia, Europe and America... 2 agosto, 2011admin The tables below show the list of the best and worst performing stock index and … Leer
Europe Index, Eurostoxx sectors... 1 agosto, 2011admin The tables below show the list of the best and worst performing stock index, … Leer
Europe Index, Eurostoxx sectors... 31 julio, 2011admin The tables below show the list of the best and worst performing stock index, … Leer
Europe Index, Eurostoxx sectors... 24 julio, 2011admin The tables below show the list of the best and worst performing stock index, … Leer
Europe Index, Eurostoxx sectors... 22 julio, 2011admin The tables below show the list of the best and worst performing stock index, … Leer
Asia, Europe and America... 21 julio, 2011admin The tables below show the list of the best and worst performing stock index and … Leer
Europe Index, Eurostoxx sectors... 21 julio, 2011admin The tables below show the list of the best and worst performing stock index, … Leer
Europe Index, Eurostoxx sectors... 21 julio, 2011admin The tables below show the list of the best and worst performing stock index, … Leer
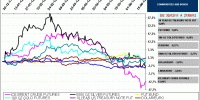
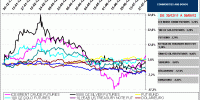
Gráficos y curvas de... 27 noviembre, 2009admin Aquí tienen el aspecto que presenta el PETRÓLEO, EL GAS Y EL EURODOLAR, desde la … Leer
Gráficos y curvas de... 26 noviembre, 2009admin Aquí tienen el aspecto que presenta el PETRÓLEO, EL GAS Y EL EURODOLAR, desde la … Leer
Materias primas, gráficos y... 26 noviembre, 2009admin Aquí tienen el aspecto que presenta una selección de materias primas, ORO, … Leer
Graficos en base 100... 10 diciembre, 2012admin Emplearé gráficos en base 100 para seguir la evolución de una selección de los … Leer
Graficos en base 100... 28 junio, 2012admin Emplearé gráficos en base 100 para seguir la evolución de una selección de … Leer
Materias primas, gráficos y... 26 noviembre, 2009admin Aquí tienen el aspecto que presenta una selección de materias primas, ORO, … Leer
Graficos en base 100... 10 agosto, 2012admin Emplearé gráficos en base 100 para seguir la evolución de una selección de … Leer
Rango de fluctuación en... 1 marzo, 2013admin La tabla que tienen a continuación reune una selección de los principales … Leer
Gráficos y curvas de... 26 noviembre, 2009admin Aquí tienen el aspecto que presenta el PETRÓLEO, EL GAS Y EL EURODOLAR, desde la … Leer