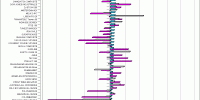
Asia, Africa, Europe and... 5 May 2013admin Histograma en el que se analiza la evolución de la bolsa en 67 países. Se … Leer
Asia, Africa, Europe and... 28 Abr 2013admin Histograma en el que se analiza la evolución de la bolsa en lo que va de 2013 en … Leer
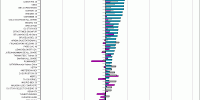
67 bolsas mundiales Histogram... 21 Abr 2013admin Histograma en el que se analiza la evolución de las bolsas de 67 países en lo … Leer
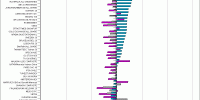
67 bolsas internacionales Histogram... 15 Abr 2013admin Histograma en el que se analiza la evolución de las bolsas de 67 países en la … Leer
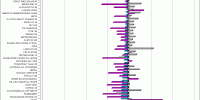
67 bolsas internacionales Histogram... 30 Mar 2013admin Histograma en el que se analiza la evolución de las bolsas de 67 países en lo … Leer
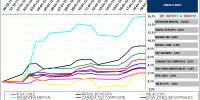
Gráficos en base 100... 14 Mar 2013admin Emplearé gráficos en base 100 para seguir la evolución de una selección de los … Leer
Performing Index, commodities, currencys.... 8 Mar 2013admin Analizamos como evolucionan una selección de los índices bursátiles mundiales … Leer
America Index and Nasdaq... 2 Ene 2013admin The tables below show the list of the best and worst performing stock index and … Leer
Asia, Europe and America... 1 Ene 2013admin The tables below show the list of the best and worst performing stock index and … Leer
Asia, Europe and America... 2 Dic 2012admin The tables below show the list of the best and worst performing stock index and … Leer
America Index and Nasdaq... 2 Dic 2012admin The tables below show the list of the best and worst performing stock index and … Leer
America Index and Nasdaq... 25 Nov 2012admin The tables below show the list of the best and worst performing stock index and … Leer
Asia, Europe and America... 25 Nov 2012admin The tables below show the list of the best and worst performing stock index and … Leer
Graficos en base 100... 6 Nov 2012admin Emplearé gráficos en base 100 para seguir la evolución de una selección de los … Leer
America Index and Nasdaq... 1 Nov 2012admin The tables below show the list of the best and worst performing stock index and … Leer
Asia, Europe and America... 1 Nov 2012admin The tables below show the list of the best and worst performing stock index and … Leer
Asia, Europe and America... 30 Sep 2012admin The tables below show the list of the best and worst performing stock index and … Leer
Graficos en base 100.... 20 Ene 2012admin Emplearé gráficos en base 100 para seguir la evolución de 9 de los índices … Leer
Asia, Europe and America... 1 Jul 2012admin The tables below show the list of the best and worst performing stock index and … Leer
Asia, Africa, Europe and... 5 May 2013admin Histograma en el que se analiza la evolución de la bolsa en 67 países. Se … Leer
Asia, Europe and America... 1 Ene 2013admin The tables below show the list of the best and worst performing stock index and … Leer
Graficos en base 100... 6 Nov 2012admin Emplearé gráficos en base 100 para seguir la evolución de una selección de los … Leer
67 bolsas internacionales Histogram... 15 Abr 2013admin Histograma en el que se analiza la evolución de las bolsas de 67 países en la … Leer